
From effluent to asset: wastewater recovery in food and beverage
A cubic metre of water costs about the same as a bag of crisps, which is exactly the problem. What I presented for the IMechE Food and Drink Engineering Committee with Carlsberg Britvic: the ceiling on efficiency, what the effluent actually costs, and why the only stream still worth money is the one we pay to throw away.
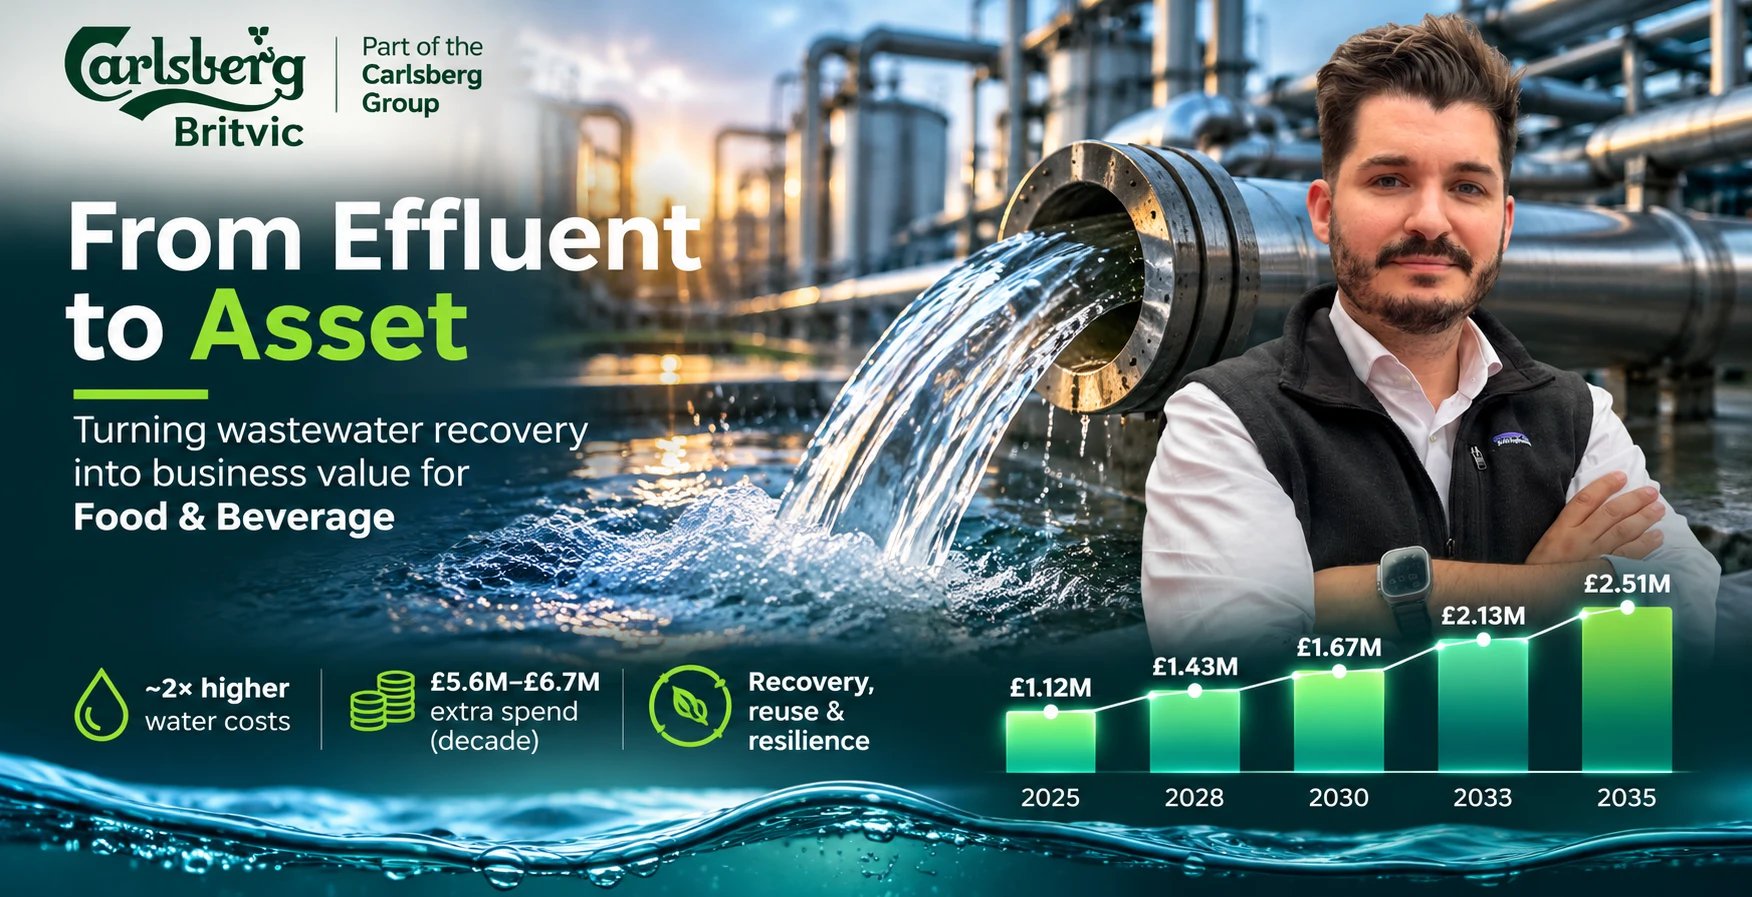
On 27 August 2026 I presented for the IMechE Process Industries Division, with the Food and Drink Engineering Committee, in a CPD-accredited technical talk called From Effluent to Asset: Wastewater Recovery in Food and Beverage. Stephen Rowe of PepsiCo covered the standards and the replenishment story; Lou Wright, Carlsberg Britvic's Head of Sustainability, and I covered what those standards turn into inside a factory. Martyn Ralph chaired. This write-up is my part: the Carlsberg Britvic story, from three water projects that worked to the question I think the industry is not asking. The recording and the slides are at the end.
Water story: why bother?
A cubic metre of water costs about the same as a bag of crisps. One to three pounds to buy it and discharge it, which is one to three pounds per thousand litres. So why bother saving it? So we don't. And that is exactly the problem.
Because we pay for it twice. For every litre we sell, between 1.4 and 3.9 litres go out as effluent. Business water charges rise 42 percent across 2025 to 2030 under Ofwat's PR24 determination. NI Water put its effluent charge up 9.6 percent in a single year. The cost is low. The exposure is not. The wager I put to the room was simple: act before you have to.
Where paper becomes plant
Carlsberg Britvic has been PepsiCo's sole partner for its beverage portfolio in Great Britain since 1987, with the agreement now extended to 2040. PepsiCo sets the standard for the brands we bottle. We manage it inside our factories, as targets, as KPIs, and as engineering decisions on real production lines. That is where paper becomes plant. Net water positive by 2030, aligned to Carlsberg Group's Brewing Tomorrow. A water use ratio that was above 1.7 litres per litre historically, sits at 1.61 today, with 1.4 as the next step, tracked by line and by site.
Three projects on the same line
We have delivered three projects along the same line of thinking: securing supply, controlling quality at capacity, and keeping treated water inside the factory. Two are running. The third is proven on a line and scaling.
Rugby, securing supply. Rising production needed more water at the right pressure, with less energy, less real estate and no downtime for the install. An on-site energy audit built the baseline. We delivered a containerised booster system with variable-speed control, dosing, disinfection and full PLC integration, built, tested and commissioned off site, then slotted in. Plus 70 percent flow capacity. Minus 45 percent energy cost.
Beckton, quality at capacity, 2023. A new production line had pushed the treatment plant beyond capacity, and at the same time chlorine in the incoming utility water was degrading our de-alkalisation resin beds, forcing annual replacement at six figures apiece. Four months of monitoring built the baseline. Then a full replacement of the pump stack, incoming water, contact tank control, degassing, carbon bed feed and backwash, under a single control philosophy. It saves 630 MWh a year, and the resin beds now last three years instead of one, at 100,000 pounds each. Priced at published UK rates, that is 218,000 to 268,000 pounds a year.
Beckton again, the bottle rinse loop, proven and scaling. By 2024 the question had shifted from how do we treat water more efficiently to why is treated water leaving the site at all. Bottle rinse water was already beverage grade, so we started there. It is captured, filtered, treated and disinfected back to high-quality process water and returned to the rinse cycle, with in-line quality testing on the SCADA system protecting production continuously, and a far lighter chemistry footprint than conventional treatment.
Two are running. The third is proven on a line and scaling.
Why the next leap is harder
Here is the uncomfortable part. The prize is capped. Our effluent bill is roughly 520,000 pounds a year across about 500 million litres. Add back the water we buy to replace it and the entire theoretical prize sits near 1.3 million pounds a year. That is the ceiling. Rising prices flatter us, because every year the same saving is worth more, but the ceiling does not move.
And there is a funding war. Energy does the heavy lifting in ESG. The 630 MWh at Beckton was worth more than any water we recovered. In truth these were energy projects that happened to be about water. So we reach a tipping point. You cannot optimise your way to zero. Every cubic metre we save costs more than the last, and the prize stops at 1.3 million. Past that, saving water is not the business we are in.
What if the effluent is not the cost?
We treat it as the thing to be got rid of. It is also the only stream on site that still contains material we paid for.
What the effluent actually costs
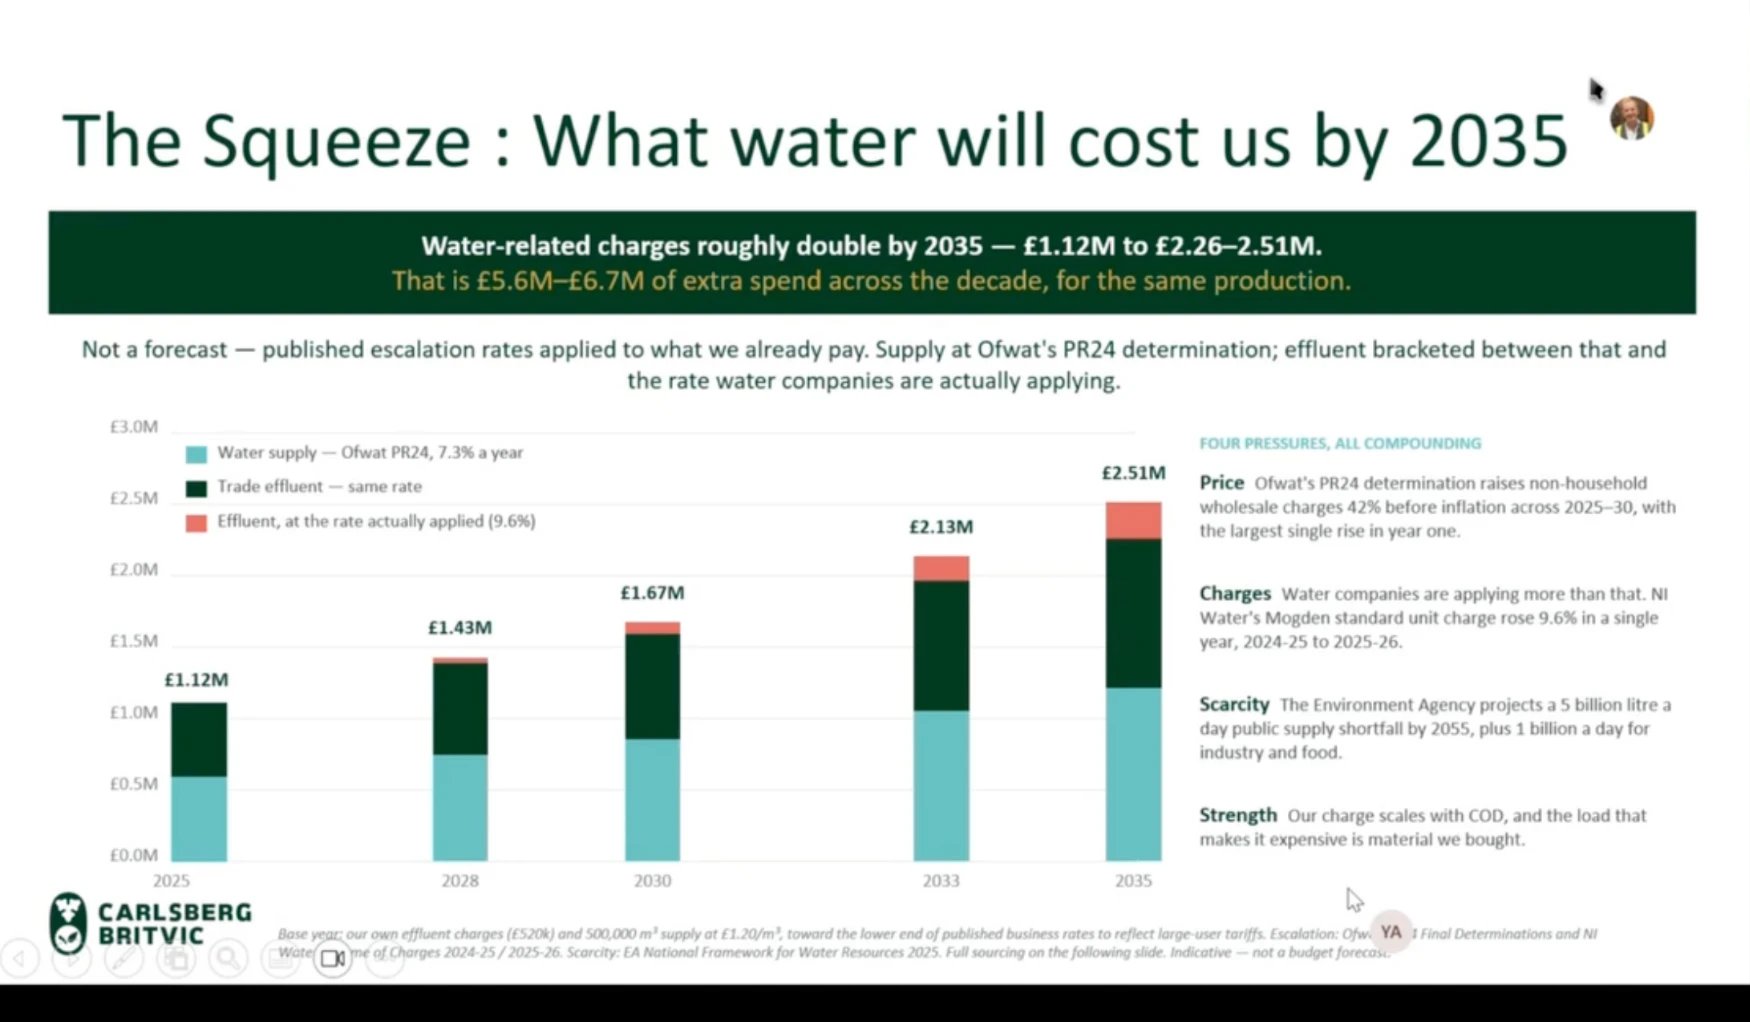
UK trade effluent is priced by the Mogden formula: partly by volume, but mostly by how loaded the effluent is. With the other terms fixed, the two that move are the COD of our effluent against the settled-sewage reference, and suspended solids against their reference, and both ratios scale linearly with load. The published components run from 8.8 to 62.9 pence per cubic metre for primary treatment, 10.9 to 92.8 pence for biological oxidation, and 9.4 to 55.4 pence for sludge. For an effluent at 2,000 milligrams per litre COD against a 360 reference, the charge works out at 3.16 pounds per cubic metre.
Our cost drivers are sugar, acid and organics: the same material we bought as ingredient and failed to put in a bottle. So we pay twice. Once at the front gate as raw material, and again at the back gate as strength on a Mogden bill. Across roughly 500 million litres of annual output that is more than 520,000 pounds a year, and it is growing at about 8.6 percent a year.
The squeeze: what water will cost us by 2035
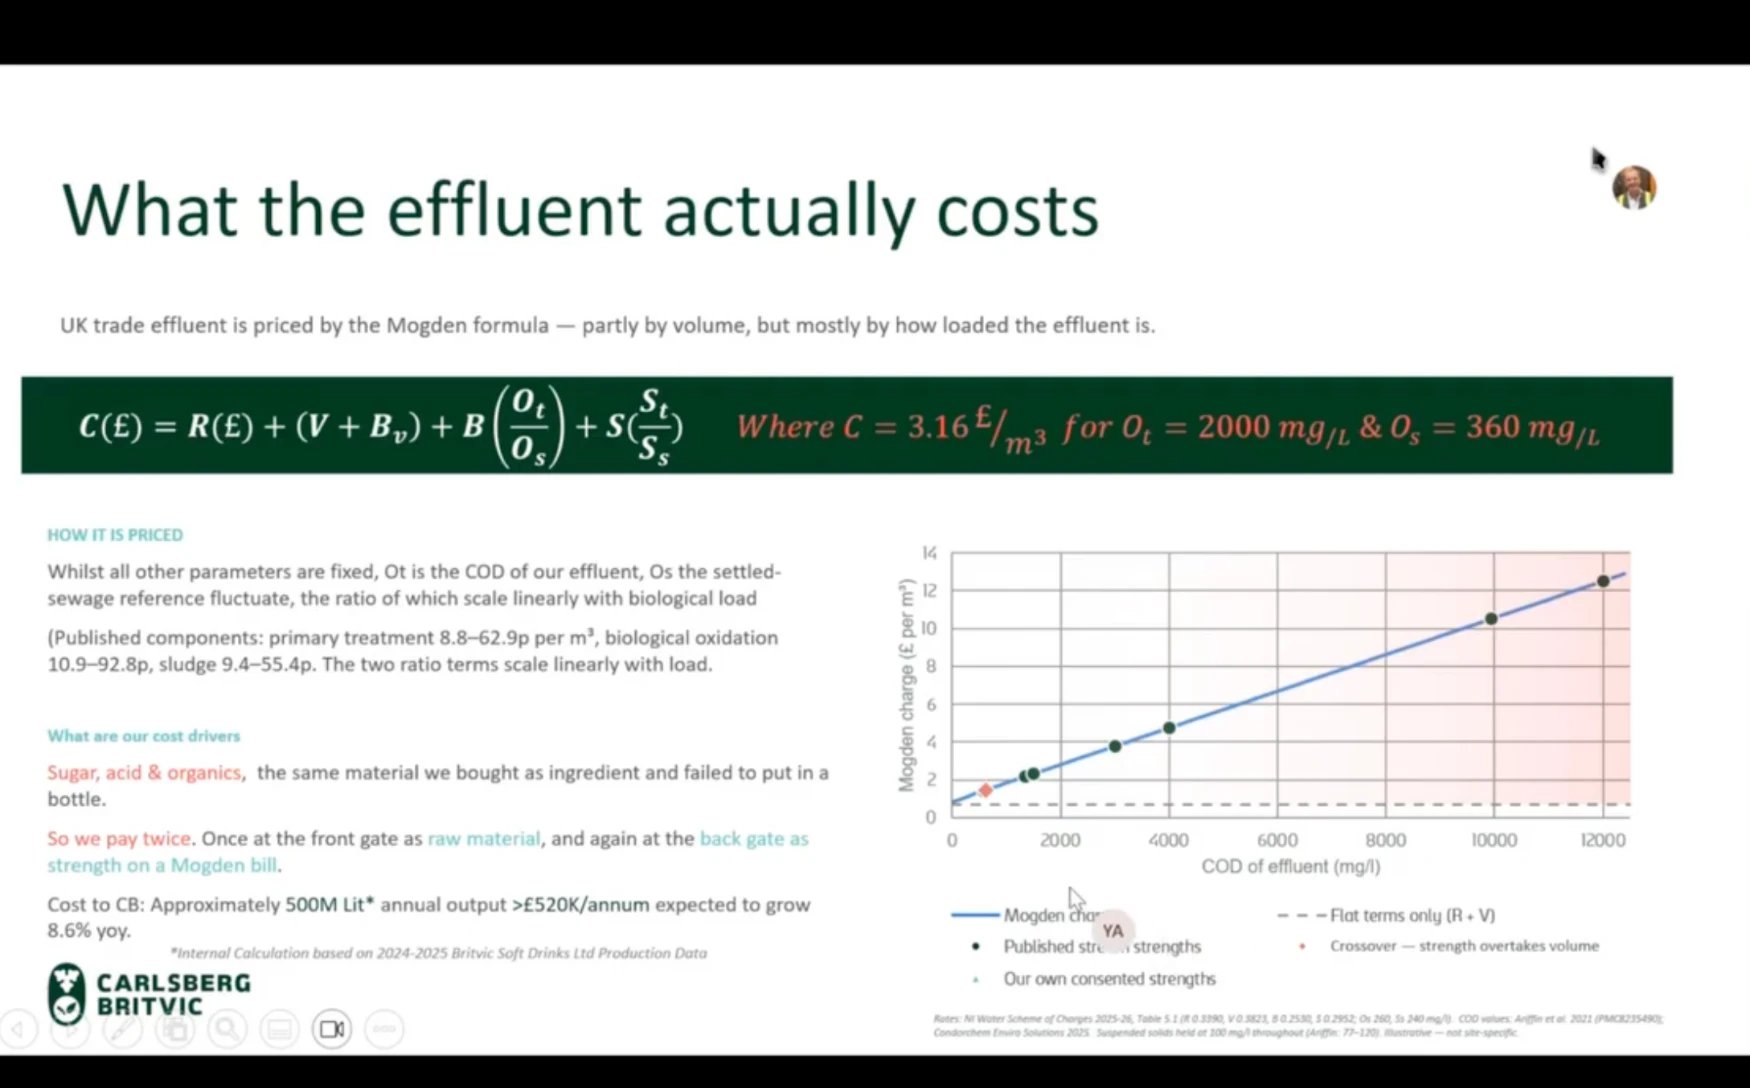
Put the published escalation rates against what we already pay and water-related charges roughly double by 2035, from 1.12 million pounds to between 2.26 and 2.51 million. That is 5.6 to 6.7 million pounds of extra spend across the decade, for the same production. It is not a forecast. Supply is taken at Ofwat's PR24 determination; effluent is bracketed between that rate and the rate the water companies are actually applying.
Four pressures, all compounding. Price: PR24 raises non-household wholesale charges 42 percent before inflation across 2025 to 2030, with the largest single rise in year one. Charges: the water companies are applying more than that, with NI Water's Mogden standard unit charge up 9.6 percent in a single year. Scarcity: the Environment Agency projects a five billion litre a day public supply shortfall by 2055, plus a billion a day for industry and food. And strength: our charge scales with COD, and the load that makes it expensive is material we bought.
There is still value in there
You can only squeeze efficiency so far. After that you have to redesign the loop, and stop treating combined effluent as the unit of analysis. The questions become: what is in it, can we recover it, can we sell it, what will it cost, who would buy it, and is it sustainable. Phase one answers the first question, with Dr Miao Guo at King's College London. Experiment: randomised mass sampling and validation to establish what is actually in each stream, in real time. Analyse: composition overlaid on production patterns, so the profile can be predicted from the schedule rather than measured after the fact. The output is a data framework that steers each stream towards its highest-value recovery route.
One case: waste to biofeed. A waste profile matched to a family of fungi used to produce mycoprotein. In the laboratory, proven: screening on our own waste streams with King's, and the yield on our biofeed came out ahead of the reference substrate it would replace. At pilot, validated: we sent our waste to an industrial alternative-protein producer, concentrated thirty-fold, and ran it at kilogram scale. The pathway held outside the lab; the results are commercially confidential. At plant, concept: a circular economy built around the recovered stream.
We did not stop at a laboratory result.
The science is published: He Y., Effective resource recovery system design for expired functional drinks through biotechnologies, PhD thesis, King's College London, 2025; and He, Zuo, Alissandratos, Willson, Kazmi, Brogan and Guo, High resource recovery potential of wasted and expired functional drinks, 2025.
The takeaways
First, the efficiency case has a ceiling, and most of us are closer to it than we admit. Second, old facilities are being closed rather than modernised. Is there a case? Third, effluent recovery works in the brewing industry. Do the financials hold in soft drinks? Fourth, the next generation of engineering projects look more like trading relationships. Are waste-based circular economies a rising trend? I ended where I always do: over to the audience. What would you push back on?
Figures are as presented in the webinar. Project savings are published case-study values priced at published UK rates (energy 24 to 32 pence per kWh for industrial users; water 90 pence to 2.40 pounds per cubic metre; trade effluent 50 to 85 pence), indicative and not audited. Effluent cost is an internal calculation on 2024 to 2025 Britvic Soft Drinks production data. Escalation: Ofwat PR24 final determinations and NI Water scheme of charges 2024-25 and 2025-26; scarcity from the EA National Framework for Water Resources 2025.